Schon mal gesehen? Wer den Jetson Nano 2GB besitzt und schon mal einige Experimente mit Tensorflow und so gemacht hat, der kennt die folgenden Log-Ausgaben betimmt.
2021-06-24 11:28:26.160087: I tensorflow/stream_executor/platform/default/dso_loader.cc:49] Successfully opened dynamic library libcublas.so.10
 2021-06-24 11:28:28.986454: I tensorflow/stream_executor/platform/default/dso_loader.cc:49] Successfully opened dynamic library libcudnn.so.8
 2021-06-24 11:28:44.183867: W tensorflow/core/common_runtime/bfc_allocator.cc:248] Allocator (GPU_0_bfc) ran out of memory trying to allocate 17.49MiB with freed_by_count=0. The caller indicates that this is not a failure, but may mean that there could be performance gains if more memory were available.
 2021-06-24 11:28:44.254723: W tensorflow/core/common_runtime/bfc_allocator.cc:248] Allocator (GPU_0_bfc) ran out of memory trying to allocate 33.00MiB with freed_by_count=0. The caller indicates that this is not a failure, but may mean that there could be performance gains if more memory were available.
 2021-06-24 11:28:44.444982: W tensorflow/core/common_runtime/bfc_allocator.cc:248] Allocator (GPU_0_bfc) ran out of memory trying to allocate 16.02MiB with freed_by_count=0. The caller indicates that this is not a failure, but may mean that there could be performance gains if more memory were available.
 2021-06-24 11:28:44.445289: W tensorflow/core/common_runtime/bfc_allocator.cc:248] Allocator (GPU_0_bfc) ran out of memory trying to allocate 24.90MiB with freed_by_count=0. The caller indicates that this is not a failure, but may mean that there could be performance gains if more memory were available.
 2021-06-24 11:28:44.445558: W tensorflow/core/common_runtime/bfc_allocator.cc:248] Allocator (GPU_0_bfc) ran out of memory trying to allocate 30.22MiB with freed_by_count=0. The caller indicates that this is not a failure, but may mean that there could be performance gains if more memory were available.
 2021-06-24 11:28:46.010259: W tensorflow/core/common_runtime/bfc_allocator.cc:248] Allocator (GPU_0_bfc) ran out of memory trying to allocate 24.51MiB with freed_by_count=0. The caller indicates that this is not a failure, but may mean that there could be performance gains if more memory were available.
 2021-06-24 11:28:46.010584: W tensorflow/core/common_runtime/bfc_allocator.cc:248] Allocator (GPU_0_bfc) ran out of memory trying to allocate 25.07MiB with freed_by_count=0. The caller indicates that this is not a failure, but may mean that there could be performance gains if more memory were available.
 2021-06-24 11:28:46.010971: W tensorflow/core/common_runtime/bfc_allocator.cc:248] Allocator (GPU_0_bfc) ran out of memory trying to allocate 16.20MiB with freed_by_count=0. The caller indicates that this is not a failure, but may mean that there could be performance gains if more memory were available.
 2021-06-24 11:28:46.011143: W tensorflow/core/common_runtime/bfc_allocator.cc:248] Allocator (GPU_0_bfc) ran out of memory trying to allocate 50.00MiB with freed_by_count=0. The caller indicates that this is not a failure, but may mean that there could be performance gains if more memory were available.
 2021-06-24 11:28:46.011286: W tensorflow/core/common_runtime/bfc_allocator.cc:248] Allocator (GPU_0_bfc) ran out of memory trying to allocate 23.88MiB with freed_by_count=0. The caller indicates that this is not a failure, but may mean that there could be performance gains if more memory were available.
Leider hat der Jetson Nano nur sehr wenig Speicher (2GB) und davon wird nach dem Booten schon eine ganze Menge verwendet, ohne dass man auch nur angefangen hat, Modelle und Trainigsdaten zu laden.
Mit dem Befehl „top“ kann man sich die gerade laufenden Prozesse ansehen und mit der Tastenkombination [SHIFT]-M nach Speicherverbrauch sortieren.
top - 11:40:59 up 4 min,  2 users,  load average: 0,56, 0,63, 0,30
 Tasks: 244 total,   1 running, 243 sleeping,   0 stopped,   0 zombie
 %Cpu(s):  1,0 us,  0,7 sy,  0,0 ni, 97,9 id,  0,0 wa,  0,2 hi,  0,2 si,  0,0 st
 KiB Mem :  2027380 total,   922244 free,   446796 used,   658340 buff/cache
 KiB Swap:  7305128 total,  7305128 free,        0 used.  1476580 avail Mem
 PID USER      PR  NI    VIRT    RES    SHR S  %CPU %MEM     TIME+ COMMAND
  5631 root      20   0 1075112  88984  43220 S   0,3  4,4   0:01.30 dockerd
  4919 root      20   0 1182620  51340  23156 S   2,0  2,5   0:01.00 containerd
  6909 michael   20   0  532520  44652  28420 S   0,3  2,2   0:01.50 python3
  6885 michael   20   0  519564  41472  30076 S   0,0  2,0   0:00.47 nm-applet
  5741 root      20   0 6455008  34388  23488 S   1,0  1,7   0:02.51 Xorg
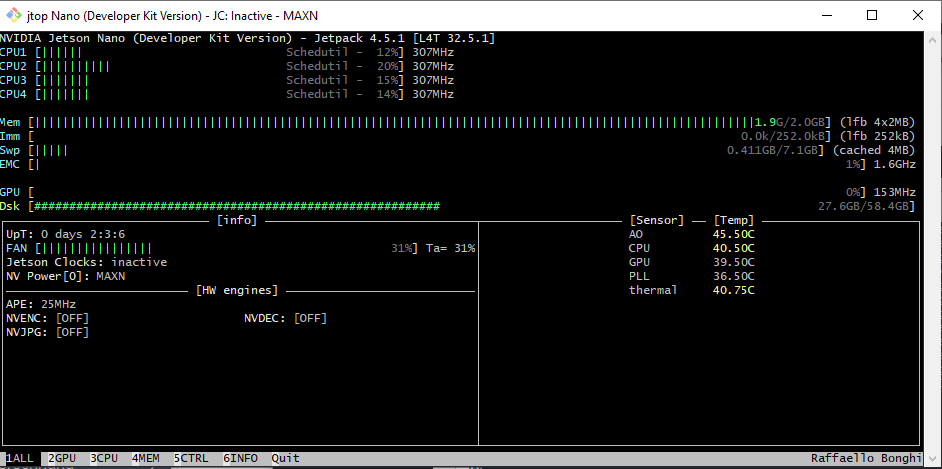
Ganz oben in der Liste stehen bei mir z.B. die X-Server Komponenten und Docker die ich eigentlich nie nutze und der von mir gerne genutzte jetson_stats Service, mit dem ich mir sehr komfortable die GPU Auslastung anzeigen kann (Siehe Bild oben). Aber was solls, weg damit. Das geht ganz einfach mit den folgenden 4 Befehlen.
sudo service lightdm stop
sudo systemctl stop docker
sudo systemctl stop containerd
sudo systemctl stop jetson_stats.service
top - 11:45:13 up 8 min,  1 user,  load average: 0,00, 0,26, 0,22
 Tasks: 206 total,   1 running, 205 sleeping,   0 stopped,   0 zombie
 %Cpu(s):  0,2 us,  0,3 sy,  0,0 ni, 99,3 id,  0,0 wa,  0,1 hi,  0,1 si,  0,0 st
 KiB Mem :  2027380 total,  1103916 free,   266704 used,   656760 buff/cache
 KiB Swap:  7305128 total,  7305128 free,        0 used.  1692416 avail Mem
 PID USER      PR  NI    VIRT    RES    SHR S  %CPU %MEM     TIME+ COMMAND
  7046 michael   20   0  519528  33444  27548 S   0,0  1,6   0:00.11 goa-daemon
  5161 root      20   0   83924  18880  14028 S   0,0  0,9   0:00.08 nvargus-daemon
  3970 root      20   0  101012  16784   8472 S   0,0  0,8   0:00.38 networkd-dispat
  4194 root      20   0  402132  16044  12688 S   0,0  0,8   0:00.51 NetworkManager
  4747 whoopsie  20   0  321520  12064  10296 S   0,0  0,6   0:00.09 whoopsie
Schon steht wieder etwas mehr Speicher für mich und meine Spielereien auf dem Jetson-Nano zur Verfügung. Es ist nicht viel (etwa. 200MB) aber was solls. Wenigstens etwas.
Wenn man mehr freien Speicher braucht, muss man ein paar Euro mehr in die Hand nehmen und sich die 4GB Version, das NVIDIA Jetson Xavier NX Developer Kit oder das Jetson AGX Xavier Entwickler-Kit kaufen. Da hat man dann sogar 4GB, 8GB oder sogar 32GB RAM zur Verfügung.
Hinweis: In der Regel läuft das tensorflow Skript trotz der Problem auf dem Jetson Nano durch – zum Glück :-).
